
PARSEC sectors: Environment, EO
Application fields: Emergency Services, Environmental, Pollution & Climate, Humanitarian Ops & Health, Insurance and Finance
Keywords: data analytics, disasters, EO data, firefighters, forest, machine learning, wildfires
Wildfires are a menace that gained much of public attention during recent years’ summer seasons. Images of swaths of Australian bush ablaze in January and February 2020 caught public attention as brave firefighters were carrying koala bears from the inferno. The Australian fires were followed by an exceptionally disastrous fire-season in the Western United States. Once again, the images of ordinary folk tragedies and firefighters were nested in the TVs capturing our attention. However, our story begins well before all of that. We start with daily and long-term forecasts and how, with the help of Earth observation data (EO), we can anticipate and better prepare for fires to come.
Wildfires are one of the natural hazards that can touch almost every corner of the globe. The magnitude and the consequences of fires are greatly exacerbated by ongoing shifts in climatic conditions and urban sprawl that puts new settlements in harm’s way. Recent fires in Australia and on the West coast of the US are a testimony to that. Over 65% of forests in Europe are considered fire-prone, whereas, in Poland, it is 83% [1]. Prompt response to the danger is of the essence, especially during the summer season. Three main factors contribute to the risk and severity of fire. EO data can provide insights for each one of them: the fuel, the long-term weather patterns, and the day-to-day meteorological conditions.
First and foremost is the fuel. Tree species composition and overall condition of the vegetation are factors to consider. For instance, forests that were infested by pests such as bark beetle have an unusually high content of deadwood available to be consumed by the fire [2,3]. The vegetation stress can be further aggravated by long-term factors such as drought. Prolonged droughts that will leave plant litter with low moisture content facilitating the ignition and spread of wildfires. The fuel and its preconditioning are long term factors that can be observed with optical and microwave sensors. The normalized difference vegetation index (NDVI) is a notable example of an optical index indicative of vegetation condition. Similarly, the active and passive microwave measurements allow for soil moisture and vegetation density estimation. Another piece of the puzzle is the meteorological condition. Thunderstorms, heatwaves, and wind, are usually the final straw that ignites and facilitates the spread of wildfire. The relative importance of these factors can change between climatic zones, land use, and countries.
As stated above, the fire-linked factors can be estimated from satellite imagery. Most of the data and methods are well proven and publicly available. Remote sensing of soil moisture is a mature technology that was tested in several climates. The data from ESA SMOS and NASA SMAP is available as near real-time products through the ESA services and other DIAS providers. Sentinel and MODIS collections provide vegetation indexes and surface temperature derived from optical and thermal infrared bands. The availability of near-real-time products makes it suitable for operational use in fire danger prediction.
Forestry authorities around the world employ various techniques and risk scales for fire hazard management. From the well-recognized Canadian Fire Weather Index system to ones like the current Polish fire hazard prediction model, which relies mostly on in-situ data [4]. We use the latter as a reference and case study to develop a Fire Danger Warning System (FDWS) based on EO data.
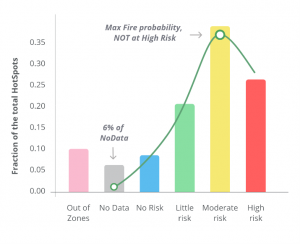
Bar plot of MODIS HotSpots (MODIS Collection 6 NRT Hotspot) by fire-danger level as predicted by the current system: red-high, yellow-moderate, green-low, blue-no risk, gray – no Data, pink-region not covered by predictions
The FDWS will improve on current systems by rectifying its key issues: station outages and sensibility of the hazard levels. Station outages are responsible for failure in perdition. According to our analyzes, 6% of fires (MODIS Hotspots) occur in regions and times not covered by the predictions. The validation against the EO Hotspots (MODIS Collection 6 NRT Hotspot / Active Fire Detection MCD14DL) [5] shows that the maximum probability of fire occurrence is under “Moderate Risk”. The non-monotonic shape of the fire probability curve across the hazard levels is indicative of misalignment of the levels thresholds, ergo not adequate sensibility. Reliance on in-situ stations implies other issues as well, such as maintenance and personnel costs. Furthermore, the number of stations is limited, and measurements are representative of specific ecosystems. Significant fragmentation of land use plots hinders the possibility of simple interpolation of measurements in order to achieve the higher spatial resolution of the perditions.
The solution to the above-recognized issues is the extensive use of remote sensing data. The aim is to deliver a daily fire hazard product with at least 10-20 km spatial resolution. The FDWS approach will contribute to a better allocation of manpower and other resources during the fire-prone season. The prototyping platform is the Google Earth Engine, which hosts a suite of EO data, e.g. optical, radar, microwave, and the higher-level EO products such as drought index and precipitation, as well as the data from the Global Forecast System (GFS). The FDWS combines the in-situ and satellite data in proven machine learning (ML) algorithms [6,7,8,9].
The Fire Danger Warning System (FDWS) designed by Eversis is based on EO data blended with real fire outbreaks and will complement the existing system by providing fire surveillance and warning on a country and regional level. The FDWS comprises of the visualization and prediction modules that are integrated into the GIS environment deployed on mobile devices suitable for managing the firefighting teams and available to all stakeholders.
The Project of FDWS is one of the selected GEO-GEE programme initiatives. The programme leverages the capabilities to scale providing GEE licenses, training, and outreach support.
BIBLIOGRAPHY
- Ubysz, B et al. “Sytuacja pożarowa w Polsce” , Report of Forest Research Institute, 2004 www.ibles.pl
- Bright, Benjamin, et al. “Prediction of Forest Canopy and Surface Fuels from Lidar and Satellite Time Series Data in a Bark Beetle-Affected Forest.” Forests, vol. 8, no. 9, 2017, p. 322., doi:10.3390/f8090322.
- Hansen, E. Matthew, et al. “Fuel Loads and Simulated Fire Behavior in ‘Old-Stage’ Beetle-Infested Ponderosa Pine of the Colorado Plateau.” Forest Science, vol. 61, no. 4, 2015, pp. 644–664., doi:10.5849/forsci.14-081.
- Forest Research Institute, Degree of Fire Hazard Methodology http://bazapozarow.ibles.pl/zagrozenie/metoda_IBL_nowa.pdf, historic data: http://bazapozarow.ibles.pl/zagrozenie/
- MODIS Collection 6 NRT Hotspot / Active Fire Detections MCD14DL. Available on-line [https://earthdata.nasa.gov/firms].doi:10.5067/FIRMS/MODIS/MCD14DL.NRT.006
- Jain, Piyush, et al. “A review of machine learning applications in wildfire science and management.” arXiv preprint arXiv:2003.00646 (2020).
- Wang, Lei, et al. “RAFFIA: Short-Term Forest Fire Danger Rating Prediction via Multiclass Logistic Regression.” Sustainability, vol. 10, no. 12, 2018, p. 4620., doi:10.3390/su10124620.
- Andrews, Patricia & Loftsgaarden, Don & Bradshaw, Larry. (2003). Evaluation of fire danger rating indexes using logistic regression and percentile analysis. International Journal of Wildland Fire – INT J WILDLAND FIRE. 12. 10.1071/WF02059.
- Chang, Yu & Bu, Rencang & Chen, Hongwei & Feng, Yuting & Li, Yuehui & Hu, Yuanman & Wang, Zhicheng. (2013). Predicting fire occurrence patterns with logistic regression in Heilongjiang Province, China. Landscape Ecology. 28. 10.1007/s10980-013-9935-4.
Leave A Comment
You must be logged in to post a comment.